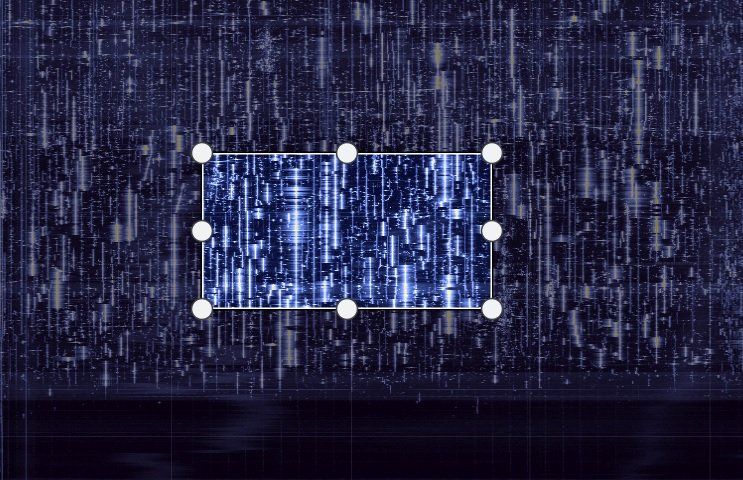
Crop the display to zoom into areas of interest. Click the Crop botton, adjust the selected area, then press Apply.
Analyser
Digging for signals
Introduction
Most SDR consoles which display data in real-time can also record the raw IQ data to a series of files for later analysis. This program is designed to analyse these recordings:
- Displays of up to 5,000 by 20,000 pixels,
- Playback synchronised with the console,
- Signal history,
- Zoom in on an area of interest.
System Requirements
This software makes heavy use of your system while analysing IQ files. The recommended minimum system configuration is:
- Windows 7 64-bit,
- i5,
- 16GB RAM (minimum),
- SSD (recommended) or fast array of raided disks.
- NVIDIA graphics card (not mandatory).
On a 'good' system the analyser processes data at a gigabyte / second or higher.
Enabling
To enable the analyser press Select in the ribbon bar, View, More Options... pane. Check Analyser and restart the program. After the restart the Analyser is displayed in the More Options... pane.
Starting
Recording
Before starting the analyser you must make a recording [link].
Projects
The basic concept is that of a Project, where a project contains:
- A list of IQ data recording files,
- The meta-data generated when these files are analysed,
- The various project settings such as width and height of the display.
Example projects:
- Graves Radar
- MW, 900kHz
Project
Performance
For maximum performance:
- Keep the recording files on a SSD, NVMe is best
- Install a NVIDIA graphics card, the software will use the CUDA cores on the card for processing-intensive work (FFT).
New
Create a new project from the Project pane of the ribbon bar.
- Select a recording, created either by SDR Console or other compatible programs.
- Optional: select the time range, by default the whole recording is processed.
- Optional: select a centre frequency and bandwidth, by default the recording centre frequency and bandwidth is used.
- Select the update rate:
- Lines per second, for example 10, or
- Total lines, for example 5,000.
- Press OK at the bottom of the project window.
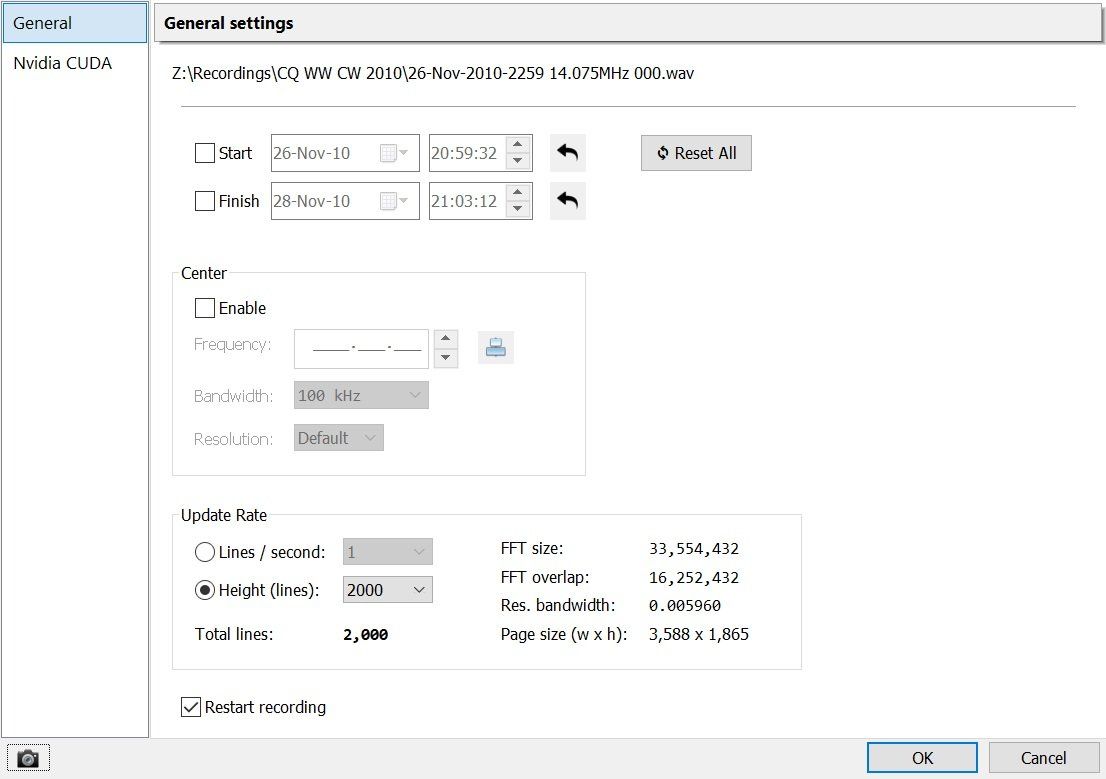
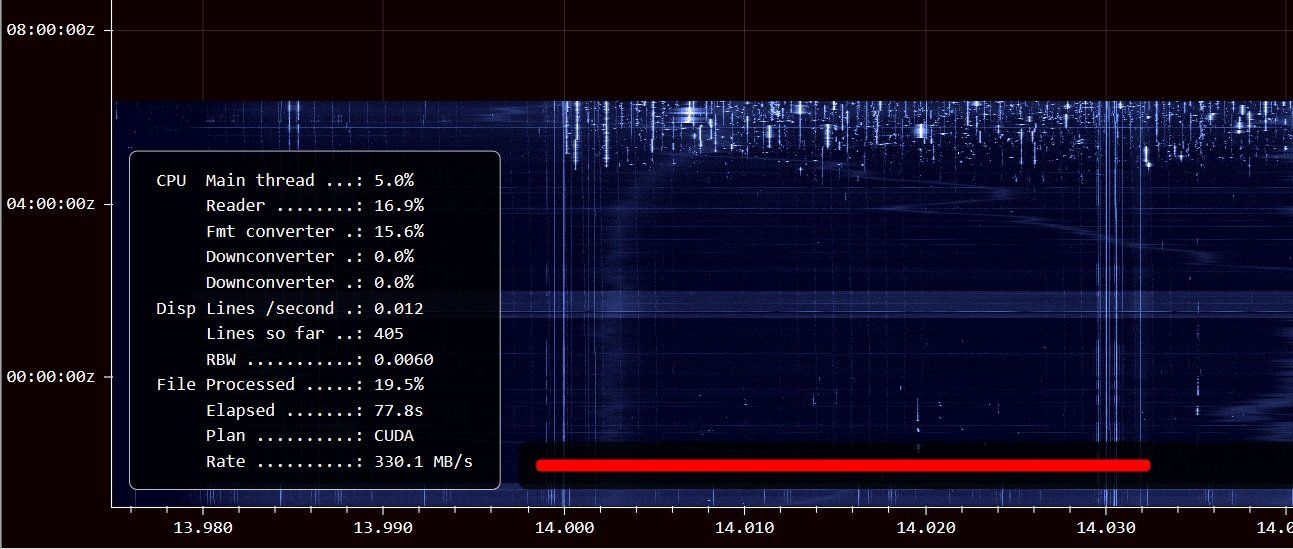
When you press OK the processing starts.
As the files are processed a red status bar is shown at the bottom of the screen together with utilisation statistics.
Save
When you have finished, save the project. This saves the current settings and the meta data used to generate the display. Loading a project takes only a few seconds compared to the considerable time it can take to create a display.
Options
Tune
When viewing signals with a standard channel spacing (example: medium wave broadcast) this is an easy way to select the next station of interest.
View
Select the information shown in the display, the Signal History and Tags interface.
Signal History
Show signal versus time for a fixed frequency, or signal versus frequency.
Tags
Text markers for signals of interest.
Crop
Image
Save the image as either a screenshot (saves exactly what you see on the screen), or saved all the data in a single image (recommended).
Playback
Selecting Start in the playback pane opens the recording in the console. When you click in the Analyser display the console frequency and time is synchronised, this is a simple but powerful playback feature. Snap the analyser frequency to a multiple of common frequency offsets.
Tools
Home brings you to this web page, Options opens the Nvidia CUDA settings.