Spectrum & Waterfall
Spectrum
The spectrum display has very powerful configuration options,
- Scale - dBm, dBµV, S-Units.
- Advanced smoothing algorithms to remove 'noise' and enhance signal visibility,
- Peak signal indication, maximum display, signal history.
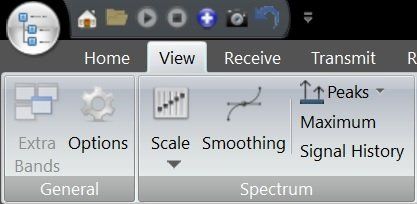
To change these options: Ribbon bar, View Spectrum.
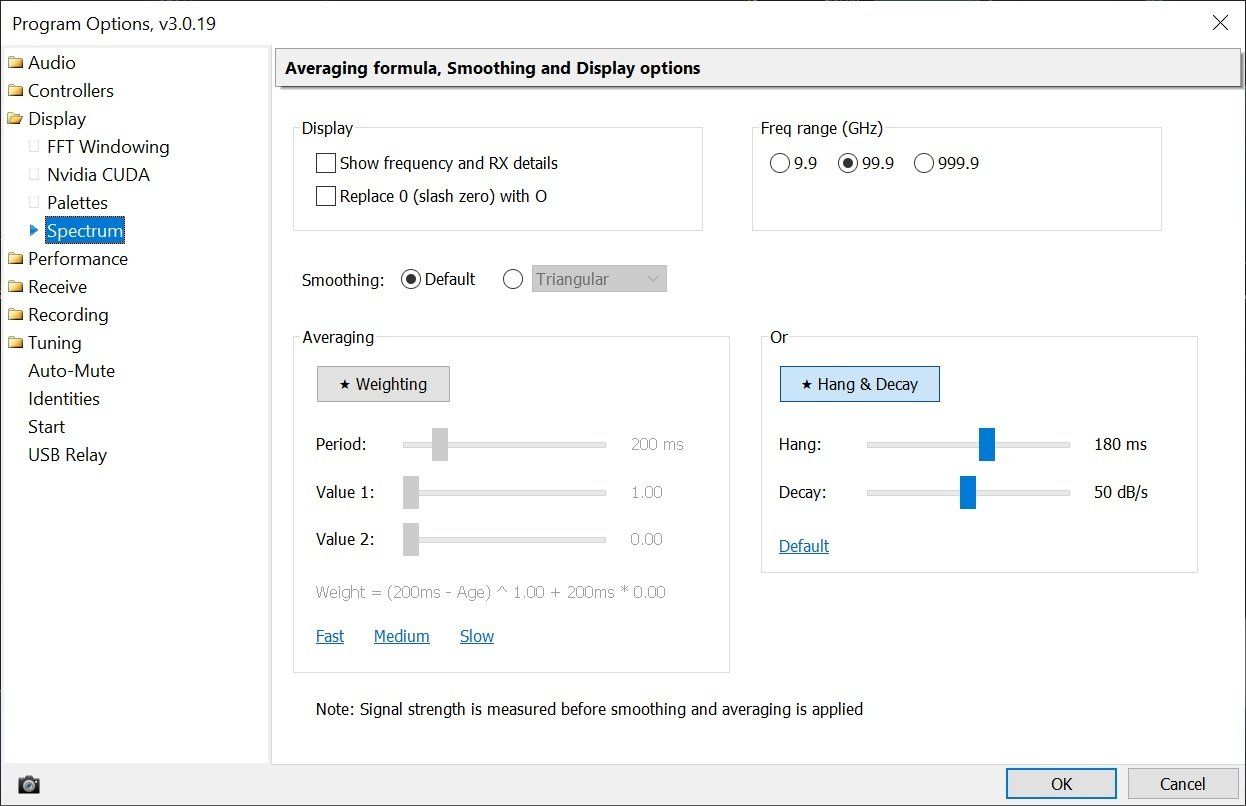
The spectrum display supports a range of smoothing options to remove 'noise' and leave the signals present.
The default averaging option is Hang & Decay, smoothing Default (the 1€ Filter).
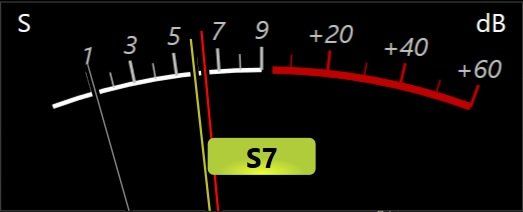
S-Meter
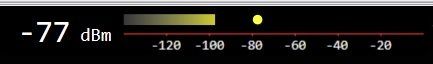
The S-Meter (Signal Meter) shows the peak and mean (average) values before smoothing is applied (see abiove), so the values shown in the spectrum will generally be lower than the S-meter value.
In the above image the peak value (yellow dot) is -77 dBm, the mean (gradient bar) is ~-98 dBm. The mean will always be less than or equal to the peak. It can never be greater than the peak.
Peak
The peak value is the peak value detected during the previous 1,000ms.
Mean
The mean value is the mean of the values for the previous 500ms.
Waterfall
The waterfall is one of the most important areas of the console display. You can adjust:
- Colour: select either a standard colour palette or a custom palette which you design yourself with the built-in colourmap editor.
- Resolution - enhance the display by increasing the resolution, this is acheived by using FFT overlapping.
- Speed - usually 40 lines/second is acceptable.
- Windowing - see Wikipedia.
Extras
Additional overlays are:
- Clock
- Statistics
- Frequency
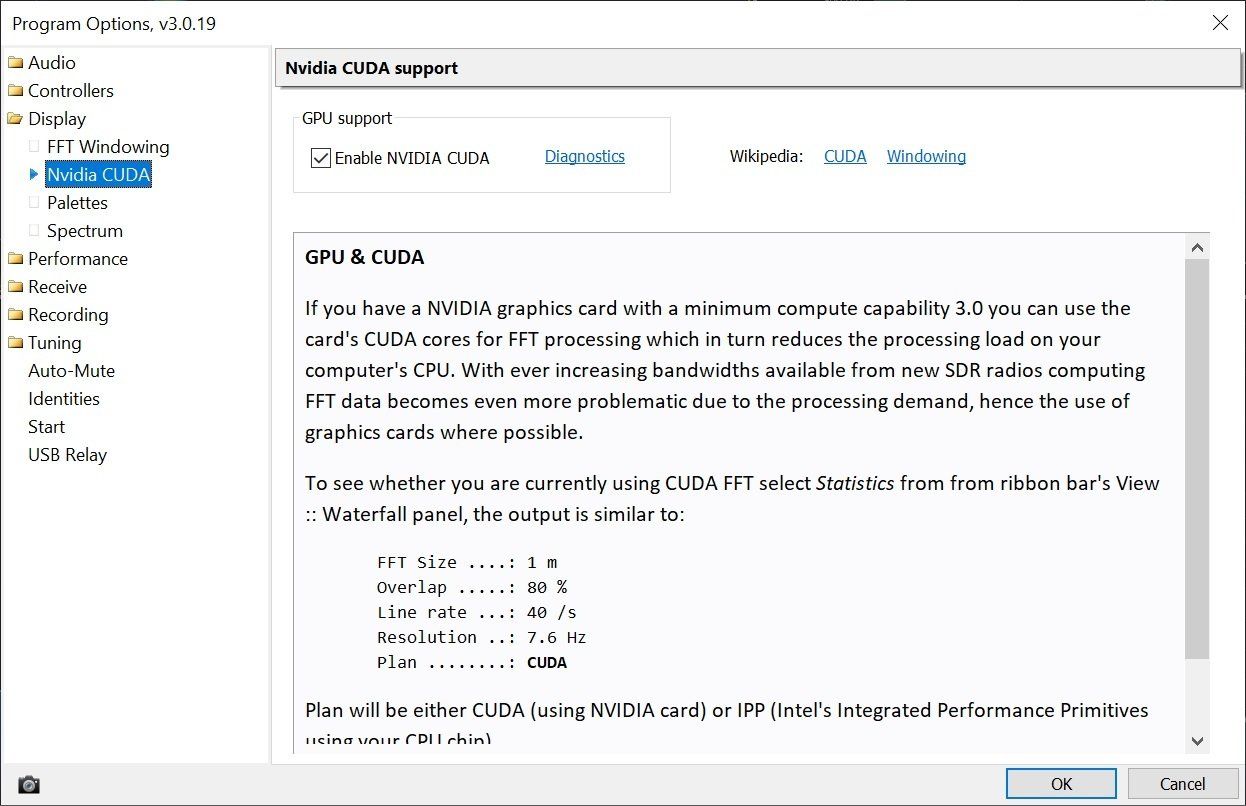
NVIDIA CUDA
The Fast Fourier transform algorithm [Wikipedia] is used to convert the SDR IQ data from the time domain into the frequency domain as shown in the spectrum and waterfall.
When processing high bandwidths (sample rates) with increased resolution this can consume considerable CPU resources. If you have a NVIDIA graphics card with a minimum compute capability of 3.0 then you can probably offload the FFT processing to this card.
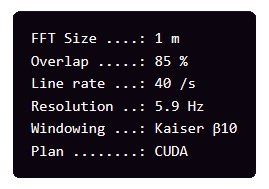
To see whether you are currently using CUDA FFT select Statistics from from ribbon bar's View :: Waterfall panel, sample output is shown here.
The plan will be either CUDA (using NVIDIA card) or IPP (Intel's Integrated Performance Primitives using your CPU chip).
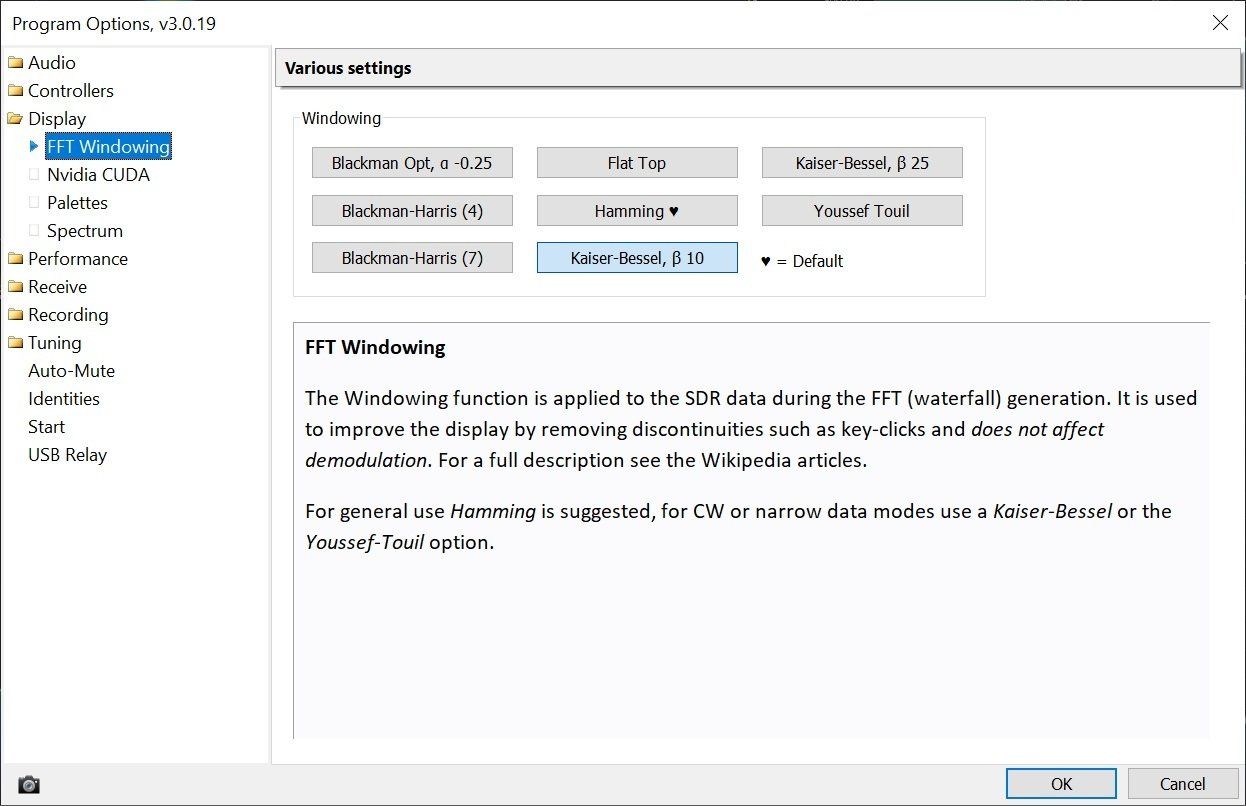
Windowing
The Windowing function is applied to the SDR data during the FFT (waterfall) generation. It is used to improve the display by removing discontinuities such as key-clicks and does not affect demodulation. For a full description see the Wikipedia article.
For general use Hamming is suggested, for CW or narrow data modes use a Kaiser-Bessel or the Youssef-Touil option.